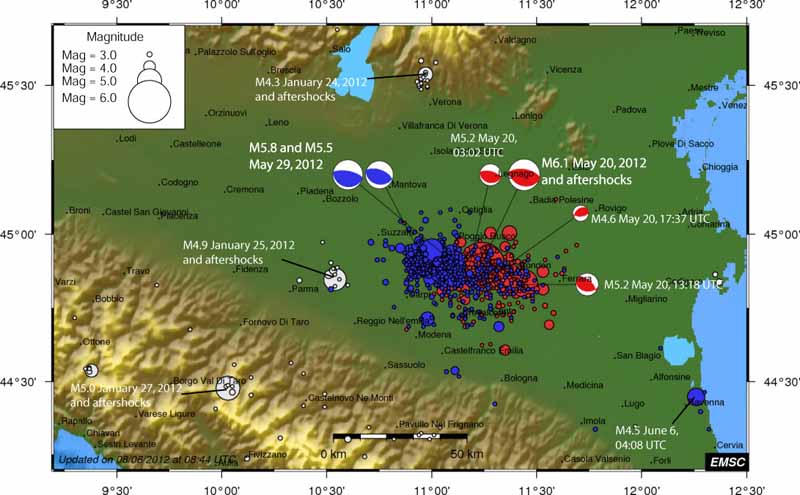
In May 2012, two major earthquakes occurred in Northern Italy.
1. On 20 May 2012 at 04:03 local time (02:03 UTC), registering magnitude 6.1, struck in the Emilia-Romagna region, about 36 kilometres north of the city of Bologna. The epicenter was between Finale Emilia and San Felice sul Panaro. The earthquake sequence began with a magnitude 4.0 foreshock at 01:13 local time (23:13 UTC 19 May). Within the next nine days, there were six aftershocks exceeding magnitude 5, 28 of magnitude 4–5 and 139 of magnitude 3–4.
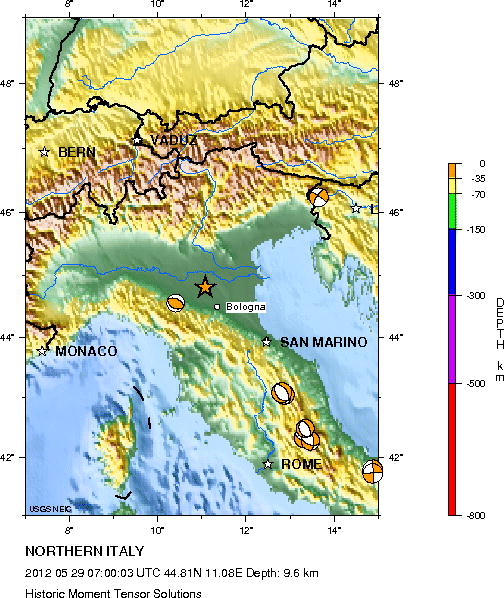
The focal mechanism indicates that the earthquake was a result of thrust faulting, with a north-south direction of compression, on a fault plane trending west-east. This type of faulting is consistent with the regional tectonic setting.
2. On 29 May (about 09:00 CEST, 07.00 UTC), a magnitude 5.8 earthquake hit the same area. The hypocenter has been estimated at 5–10 kilometers below Mirandola. A series of two or three, according to different sources, strong aftershocks with magnitudes larger than 5 occurred at between 12:55 and 13:02 local time.This earthquake had a similar mechanism to the 20 May shock.
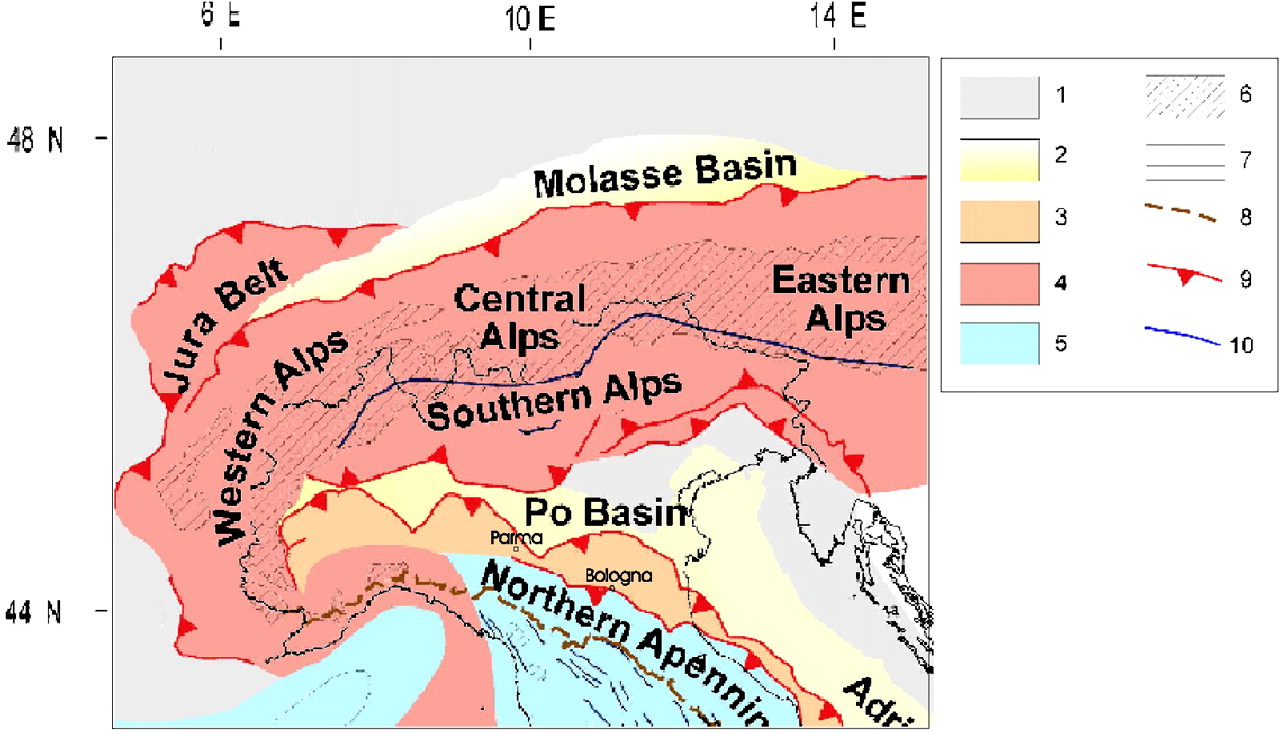
Northern Italy is characterized by different geological structures such as the sedimentary basin of the Po Valley that is bounded by the northern Apennines to the south and by the Alpine chain to the north. The Po Valley is generally characterized by efficient S-wave propagation with respect to the western Alps and the northern Apennines. In contrast, high attenuation is observed in the northern Apennines due to the presence of high
heat flow.
|
Simplified tectonic map of northern Italy derived by Carminati et al. (2004): (1) foreland areas, (2) foredeep deposits, (3) domains characterized by a compressional tectonic regime in the Apennines, (4) thrust belt units accreted during the Alpine orogenesis in the Alps and in Corsica, (5) areas affected by extensional tectonics, (6) outcrops of crystalline basement, (7) regions characterized by oceanic crust, (8) Apennines water divide, (9) thrusts, and (10) faults.
|
The Po Plain, a foreland basin formed by the down flexing of the crust by the loading of the Apennine thrust sheets, overlies and mainly conceals the active front of the Northern Apennines fold and thrust belt, across which there is about one millimeter (0.04 in) per year of active shortening at present. Information from hydrocarbon exploration demonstrates that the area is underlain by a series of active thrust faults and related folds, some of which have been detected from anomalous drainage patterns. These blind thrust faults are roughly WNW-ESE trending, parallel to the mountain front, and dip shallowly towards the south-southwest.
|
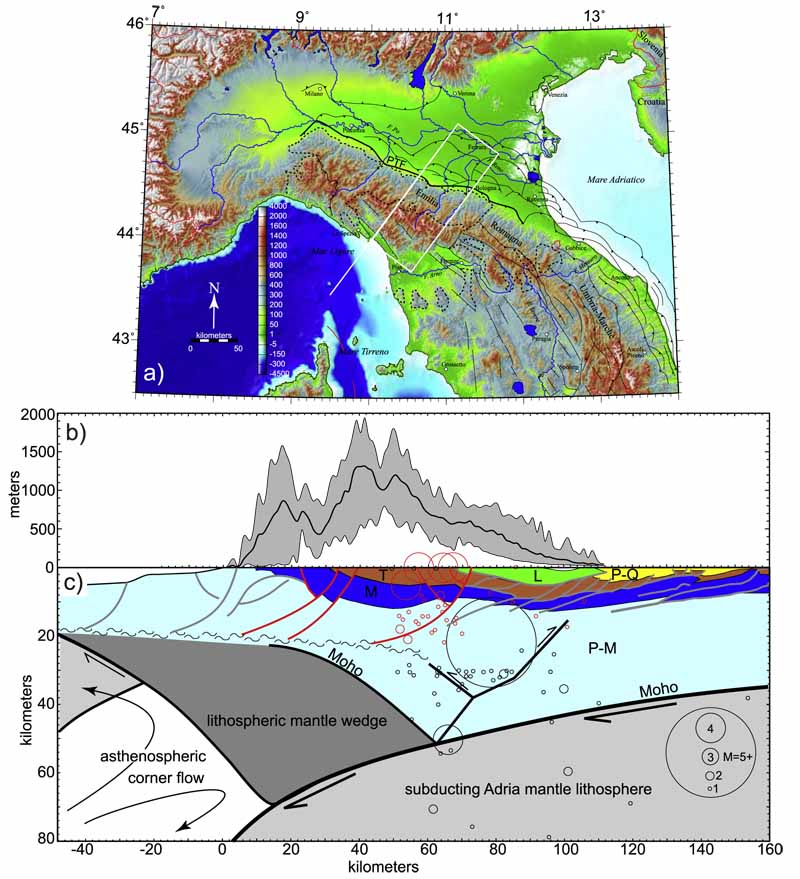
(a) Shaded topography (Shuttle Radar Topography Mission, SRTM 90 m) and bathymetry (General Bathymetric Chart of the Oceans, GEBCO 1 km) of northern and central Italy and the study location (white box). Thrust faults have triangles on the upper plate, and normal faults have tics in the direction of the hanging wall. PTF - Pedeapenninic Thrust Fault. The thick dotted lines encircle the approximate location of Ligurian and epi-Ligurian rocks.
(b) Topographic swath profile across the northern Apennines representing the topography of the white box all projected to a cross-section line defined by the box’s western edge.
(c) Generalized crustal and upper mantle geologic cross-section and earthquake epicenter data. Line of cross-section is shown by the white line on the western side of the white box, extending to the offshore. P-Q - Pliocene-Quaternary deposits; L - Ligurian nappe; T - imbricated Tertiary siliciclastic foredeep turbidites; M - Mesozoic limestones; P-M - deformed Paleozoic-Mesozoic Tethyan crust, undifferentiated. Emilia, Romagna, and Umbria-Marche refer to segments of the Apenninic chain.
|
Crustal deformation, rock uplift and topographic growth of the Apennines (Italy) are tied to the subduction of Adria, a process that began in the Oligocene during Alpine orogenesis and a period of major Mediterranean plate reorganization.
The May earthquakes in Northern Italy occurred as a result of shallow thrust faulting. At this location, the geology is dominated by compression tectonics forming thrust-belt type structures like the Apennine Mountains.
The broader Mediterranean region is seismically active due to the northward convergence (4-10 mm/yr) of the African plate with respect to the Eurasian plate along a complex plate boundary. This convergence began approximately 50 Ma and was associated with the closure of the Tethys Sea. The modern day remnant of the Tethys Sea is the Mediterranean Sea.
The figure above shows a visual representation of the style of faulting (focal mechanism) derived from the estimated moment tensor. Shaded areas show quadrants of the focal sphere in which the P-wave first-motions are away from the source, and unshaded areas show quadrants in which the P-wave first-motions are toward the source. The dots represent the axis of maximum compressional strain (in black, called the "P-axis") and the axis of maximum extensional strain (in white, called the "T-axis") resulting from the earthquake.
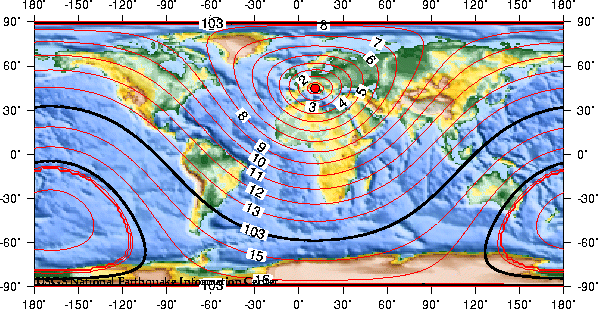
This map shows the predicted (theoretical) travel times, in minutes, of the compressional (P) wave from the earthquake location to points around the globe. The travel times are computed using the spherically-symmetric IASP91 reference earth velocity model. The heavy black lines shown are the approximate distances to the P-wave shadow zone (103 to 140 degrees).
To Top
Shadow zone.
The shadow zone is the area of the earth from angular distances of 104 to 140 degrees from a given earthquake that does not receive any direct P waves. The shadow zone results from S waves being stopped entirely by the liquid core and P waves being bent (refracted) by the liquid core.
Through measuring how P and S waves travel through the earth and out the other side, a seismic wave shadow zone was discovered in about 1910. From the lack of S waves and a great slowing of the P wave velocity (by about 40%) it was deduced that the outer core is made of liquid. The shadow zone also defined the diameter of the core.
To Top
Direct S-wave and Coda Attenuation Tomography in Northern Italy.
Attenuation tomography revealed lateral complexity for northern Italy that comprises the Alps–Apennines junction zone and the foredeep basin (Po Plain) of both chains. The results consistently show the same trend for different frequency bands and for both coda and direct waves, though lateral coda attenuation is smoother, especially for high and low frequencies.
A low attenuation area is observed in the southern part of the western Alps characterized by the presence of crystalline massifs. To the north of this zone, in the western Alps, a large low Q anomaly is observed in correspondence with the Ivrea body. The large range of frequency in which the anomaly is observed indicates a variable scale length of the heterogeneity.
The results also show high Q under the Po Plain, the largest alluvial basin of northern Italy. This region has a complex geological and structural setting because the thrust fronts of the northern Apennine are buried by variable thickness, quaternary alluvium, which might cause the anomalous propagation.
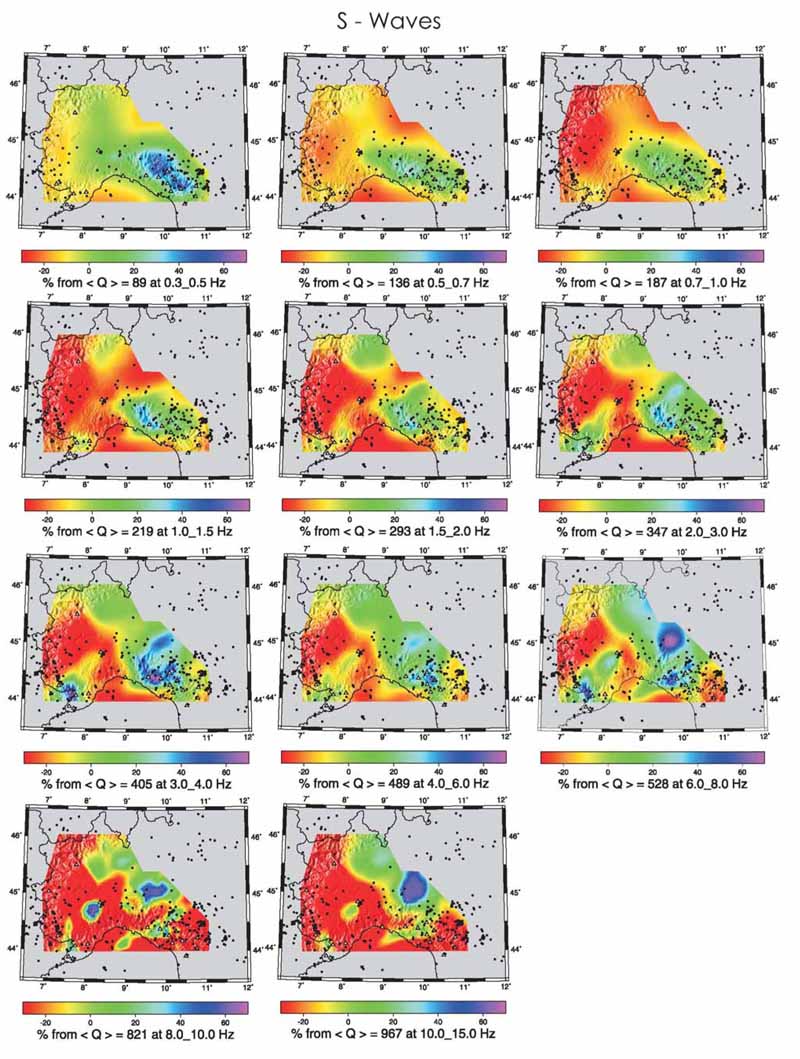 The 2D inversion results for direct waves for all analyzed frequency bands. The value of (Q) at the bottom of each image is the average quality factor for the resolved area (the colored portion of each map) for each frequency. The color scale indicates the variation in percentage with respect to (Q). White triangles represent the stations while black circles are the events used for each inversion.
|
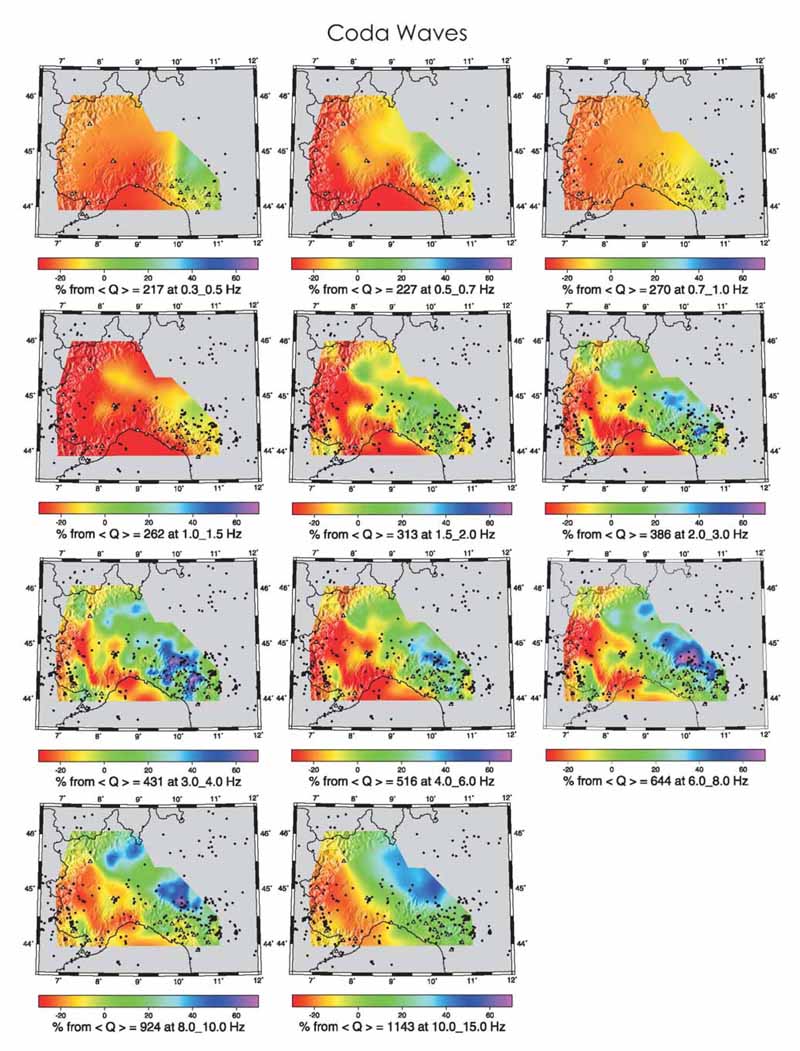 Q tomography results for coda waves at all frequency bands. Each image shows the variation of Q in percentage with respect to the average value reported at the bottom of each image (〈Q〉). The colored portion of each map delineated the region where we have good resolution. White triangles represent the stations while black circles are the events used for each inversion.
|
P-wave tomography of the mantle under the Alpine-Mediterranean area.
Some results of the study the upper mantle P wave velocity structure below the Euro-Mediterranean area, down to 1000 km depth, by seismic travel time tomography.
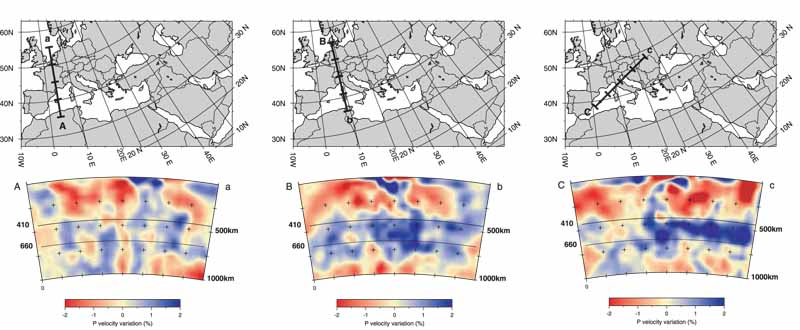
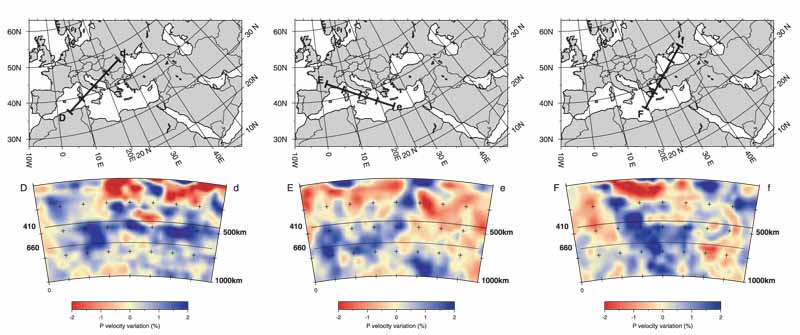
Cross sections through some of the main features of the velocity model. The top map
illustrates the section location. Each cross section has the same length (approximately 20o along a great circle) and its vertical extent reaches the bottom of the model. Ticks along the line segment indicate the distance from the extremities by 5o intervals. Below the map, one panel is plotted: the panel for the model. Ticks at 5o intervals along the upper axis of the panel correspond to the locations along the section line segment plotted on the map.
The 410 and 660 km discontinuities are indicated as a thin and thick lines, respectively.
|
A-a - Low velocity heterogeneity beneath the Massif Central (topmost 250 km). The synthetic test shows that the central portion of the section is well resolved, but some vertical leaking occurs and the narrow, conduit-like structure is probably not a robust feature.
B-b - Section running approximately along the European Geotraverse. A fast feature deepens from the surface below the central Alps, its strongest portion reaching about 200 km depth. From ray sampling and the impulse recovery test, we expect a good resolution in the central portion of the section. Notice also the accumulation of fast material between 400 and 800 km.
C-c - Shallow fast anomaly below the northern Adriatic Sea possibly connected with the fast structure, below the northern Apennines. On the Tyrrhenian side, a wedge-shaped slow anomaly just above the slab merges with the lower amplitude western Mediterranean slow anomaly down to 400 km depth.
D-d - Strong slow anomaly beneath the central Apennines (0–250 km depth). To the east, the fast Adriatic lithosphere deepens below the Dinarides.
E-e - High velocity anomaly on the Ionian side of the Calabrian Arc connected to the fast structure steeply dipping below the arc into the mantle and bending horizontally in the transition zone. The synthetic test indicates that horizontal smearing may result in artifacts along this section at midmantle depths.
F-f - Fast material can be followed from the surface through the upper mantle, across the 670 km discontinuity and down to the bottom of the model in the Hellenic Trench. A large amplitude, well sampled, low anomaly wedge is found in correspondence of the Aegean Basin. Correlation between density of rays and shape of input anomalies indicates that smearing of these small anomalies likely occurs in the deeper part.
Sources of information:
1. Morasca P., K. Mayeda, R. Gok, S. Phillips, L. Malagnini,(2008) 2D Coda and Direct-Wave Attenuation Tomography in Northern Italy, Bulletin of the Seismological Society of America, vol. 98, issue 4, pp. 1936-1946 DOI: 10.1785/0120070089
2. Picotti, V. and Pazzaglia, F. J., (2008), A new active tectonic model for the construction of the northern Apennines mountain front near Bologna (Italy): Journal of Geophysical Research, 113, doi:10.1029/2007JB005307.
3. Piromallo C., Morelli A., (2003) P wave tomography of the mantle under the Alpine-Mediterranean area, Journal of Geophysical Research, VOL. 108, NO. B2, 2065
4. Websites:
- http://en.wikipedia.org/wiki/2012_Northern_Italy_earthquakes .
- http://www.emsc-csem.org/Earthquake/209/M-6-1-NORTHERN-ITALY-on-May-20th-2012-at-02-03-UTC.
- http://earthquake.usgs.gov/earthquakes/eqarchives/fm/neic_b000a1mn_fmt.php.
- http://earthquake.usgs.gov/learn.
- http://earthquake.usgs.gov/earthquakes/eqarchives/poster/2012/20120529.php.
- http://www.emsc-csem.org.
- http://www.corriere.it/cronache/12_maggio_29/terremoto-scossa-nord-italia_0a299d18-a95d-11e1-a673-99a9606f0957.shtml.
To Top


